I’m a strong believer in the power of “View Page Source” in the browser. But that doesn’t get you very far in this era of AJAX and Flash. If you want to see the real action these days, then you need to use a debugging proxy.
On windows, my recommended proxy is Fiddler. Primarily because Fiddler will automatically configure itself as the proxy server for Internet Explorer on startup and automatically remove itself on shutdown. If you use something like Burp, then you’ll need to manually configure the browser proxy server host and port [and more importantly, manually disable the proxy configuration when you’re done]. The downside of this WinINet magic is that you may pick up HTTP requests from any HTML mail you receive in Outlook.
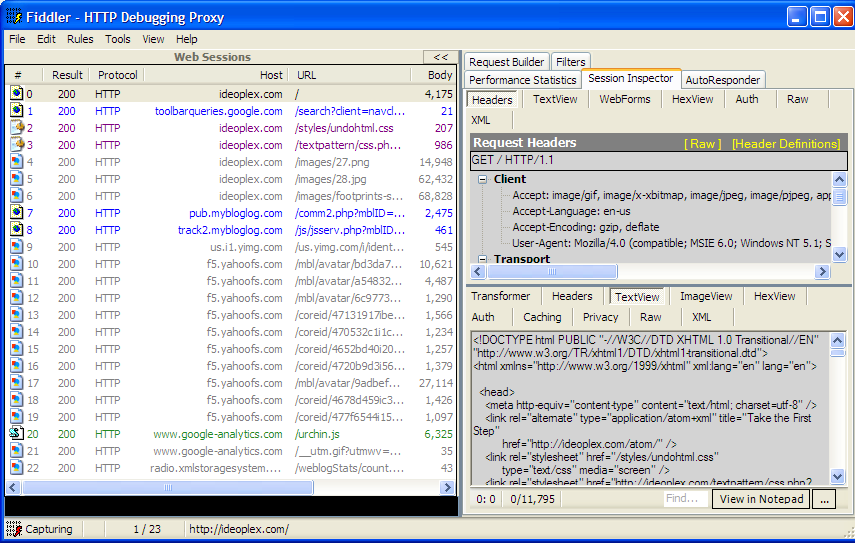
The following image shows the Fiddler results for the Take the First Step home page. The left pane shows all the HTTP requests and the right pane provides detail on the selected request. Skimming down the requests, you can see that I have the Google toolbar installed in IE and that Take the First Step uses MyBlogLog, Google Analytics, and the Radio Userland webbug.
Of course, there really isn’t anything here at Take the First Step that you couldn’t find just as easily via “Page Info” or “View Page Source”. But I’m confident that you’ll find a visit to your favorite AJAX site quite illuminating.